Skip to content

Summary status

Summary in preparation

A complete-article summary has not yet passed editorial review. This preview is deliberately limited to three pilot articles before the wider catalogue is processed.

How Worthing Became the 'Shoplifting Capital of the UK'

Commercial crime rankings repeatedly put Worthing at or near the top for shoplifting. The recorded figures were real, but reporting changes, denominator choices and old data materially changed what they could tell us.

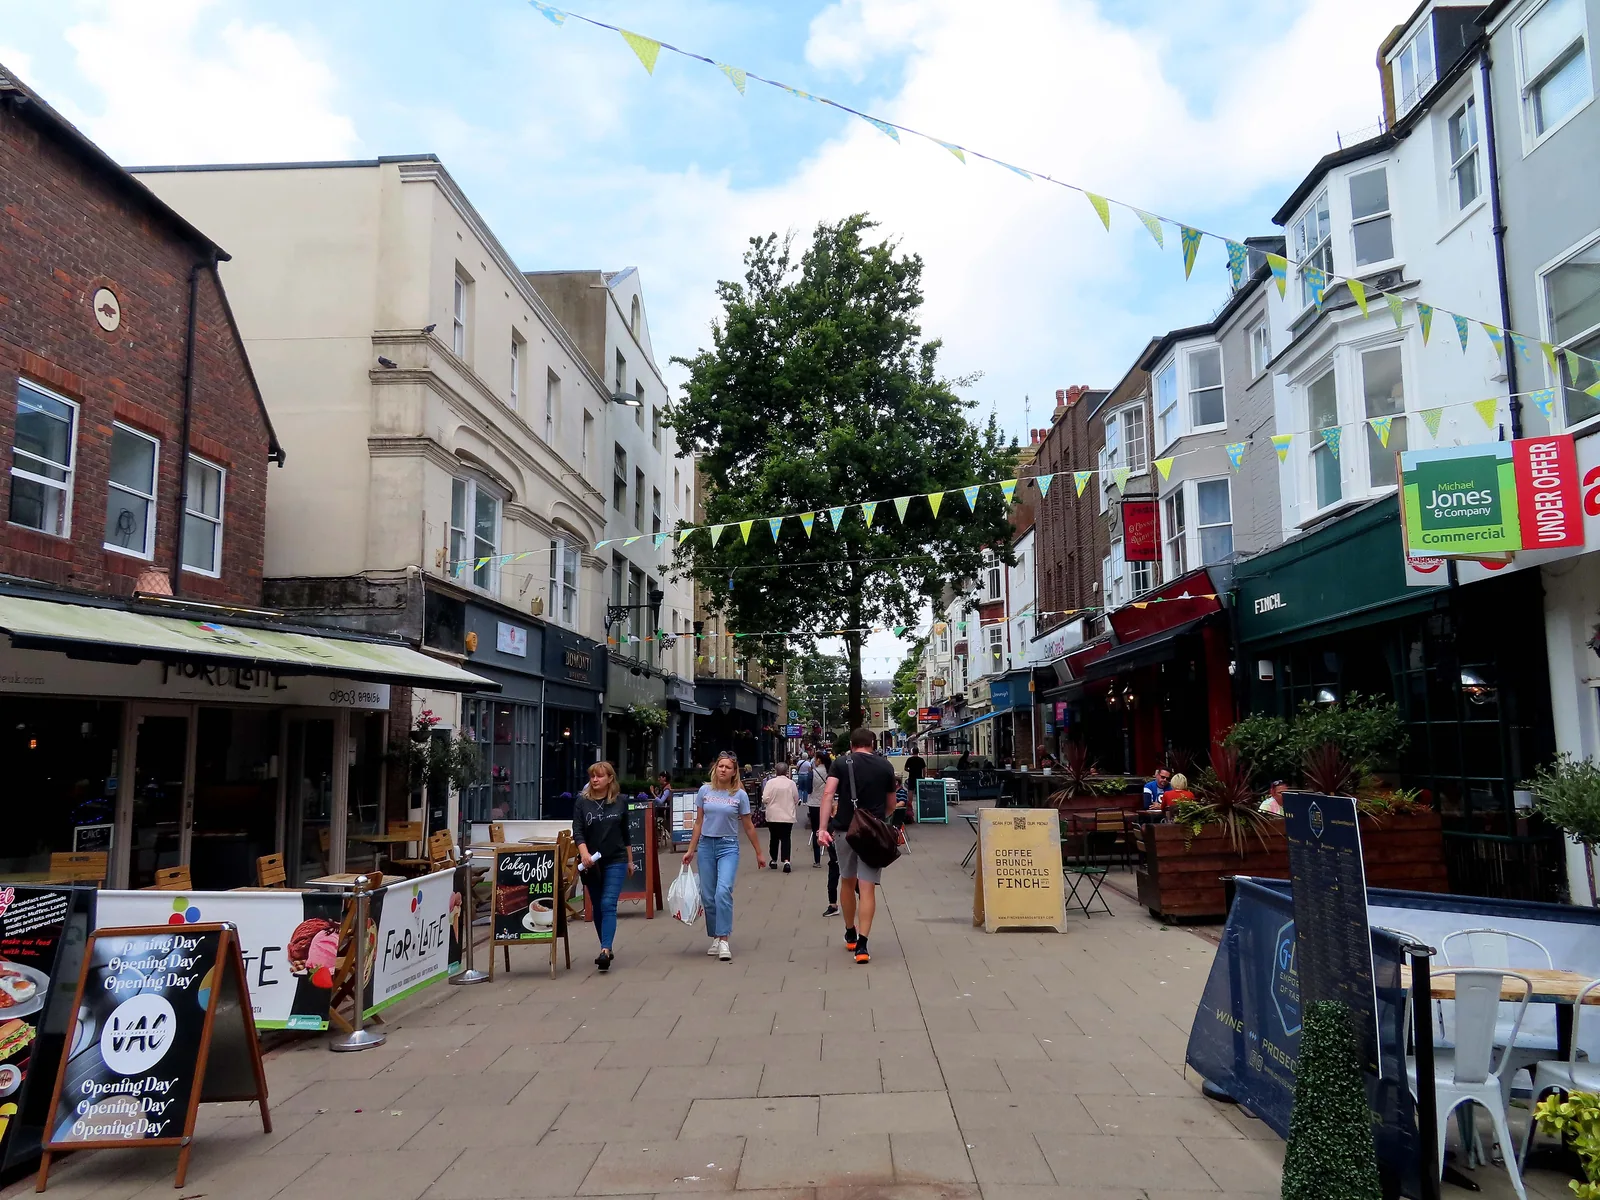
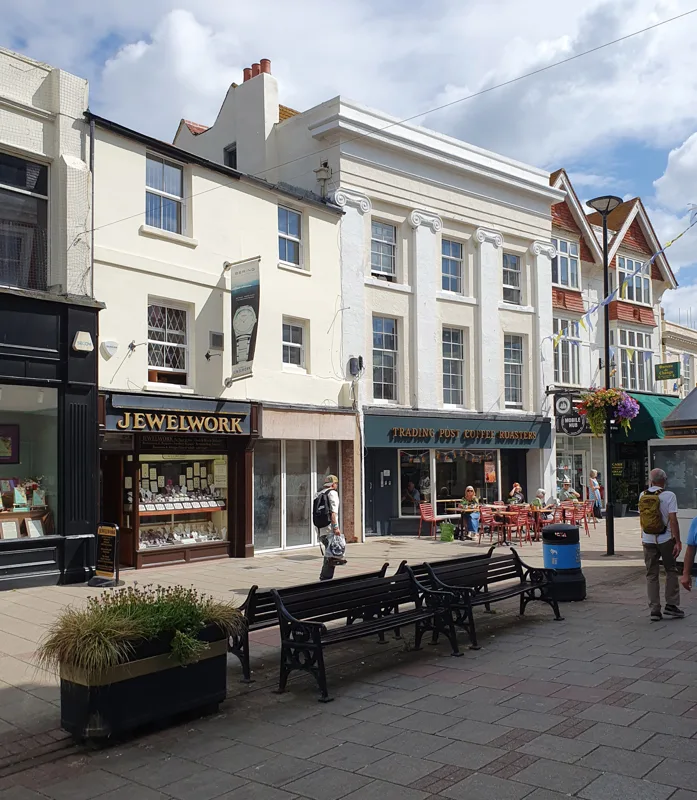
Montague Street in Worthing: a pedestrianised shopping street of independent shopfronts, benches and shoppers on a sunny day

Audio edition

≈ 12 min · narrated

Member review

Mark this passage for editorial review

Your selection, note and article location are sent to the private editor queue. Your account is used to verify that you are a member.

Worthing was named the UK’s worst town for shoplifting in February 2025. The recorded rate behind the claim was real. It did not establish that more shop theft was actually happening in Worthing than anywhere else.

That distinction is the centre of this article. A police-recorded crime rate depends on what happens, what gets reported, what gets recorded and the population used to calculate the rate. In Worthing, all of those questions mattered. The evidence supports a narrower conclusion than the headlines: Worthing had a high recorded shoplifting rate in the data used for the ranking, but the available data cannot establish that it had Britain’s highest underlying level of shop theft.

What the rankings actually measured

Radio Worthing’s report of the Accu Components study put Worthing first at 23.2 recorded shoplifting incidents per 1,000 residents on 17 February 2025. It said the study had analysed ONS, NISRA and Scottish Government crime statistics.

The source matters because the measure matters. The ONS user guide to crime statistics says police-recorded shoplifting is frequently under-reported and warns that movements in the series can reflect changes in reporting behaviour or police recording practice as well as changes in offending. ONS’s national bulletin for the year ending March 2026 similarly says recent changes in recorded shoplifting are likely to reflect both offending and improved reporting following closer police-retailer engagement. ONS, Crime in England and Wales, year ending March 2026.

Shops on Montague Street in Worthing town centre, West Sussex
Montague Street, Worthing. Photo by Mutney, CC BY 4.0, via Wikimedia Commons.

The headline soon became broader than the statistic

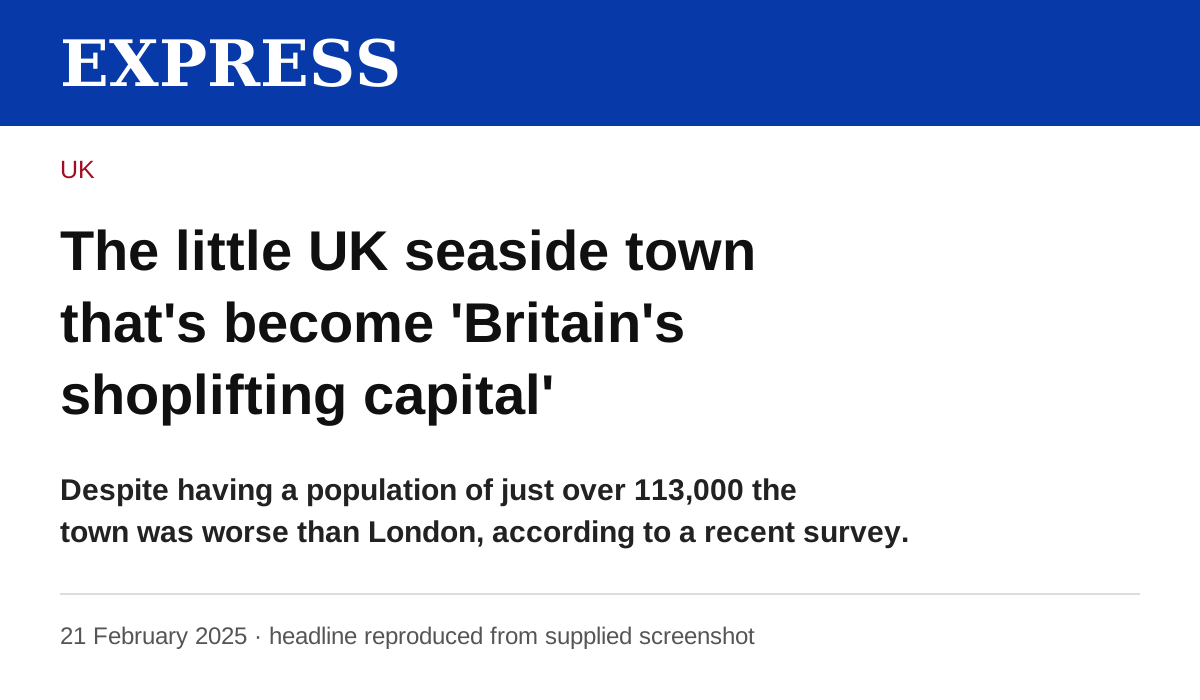
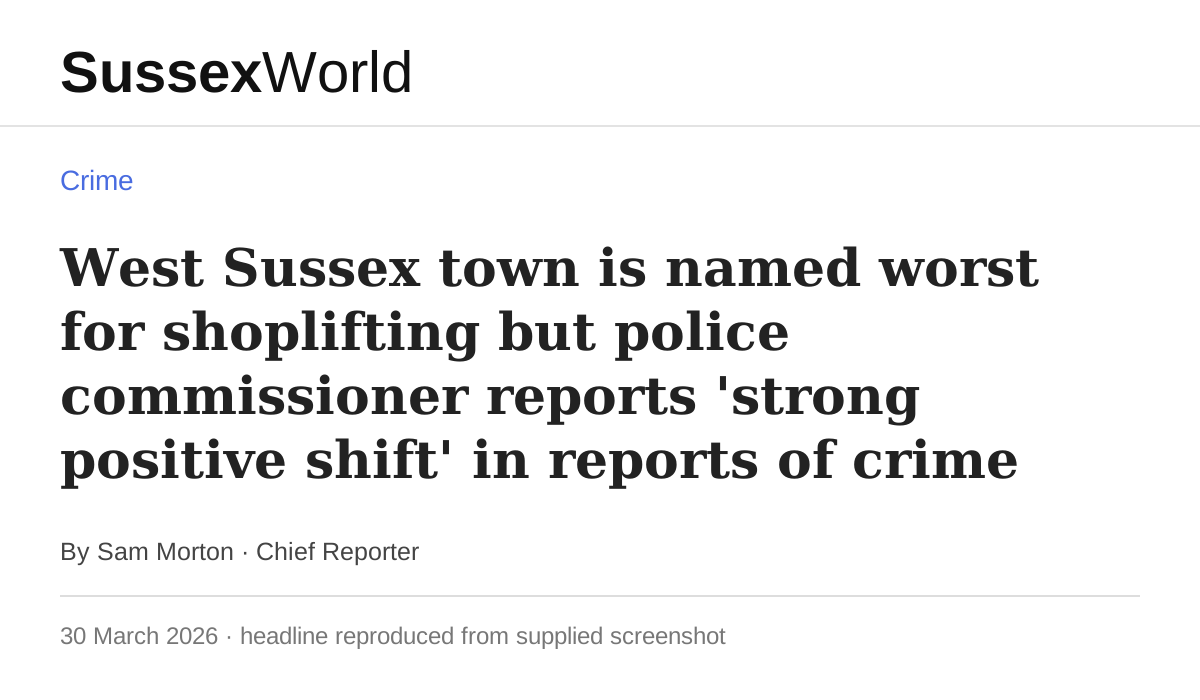
The progression is clearer when the coverage is put next to one another. The three graphics below reproduce the headline wording and dates visible in author-supplied captures of the original publisher pages. They are redrawn headline cards, not screenshots of the full pages: browser chrome and advertising have been removed, and the captions state what has been reproduced.

Daily Express headline: The little UK seaside town that's become Britain's shoplifting capital
Daily Express, 21 February 2025. Redrawn from an author-supplied capture of the original page. A recorded-crime ranking had become a description of the town itself.
SussexWorld headline: West Sussex town is named worst for shoplifting but police commissioner reports strong positive shift in reports of crime
Sussex World, 30 March 2026. Redrawn from an author-supplied capture of the original page. The headline retained the ranking but also reported the Police and Crime Commissioner's positive account of the changing local picture.
The Sun headline describing Worthing as a shoplifter's paradise
The Sun, 4 April 2026. By this stage the language had moved well beyond the narrow statistical claim that produced the original ranking.

Those headlines are evidence of how the story was framed. They are not evidence that Worthing had the highest underlying prevalence of shop theft. The Sun article itself still relied on police-recorded rates, including a LEI Register figure of 231.79 thefts per 10,000 residents and a separate comparison that placed Westminster above Worthing. The Sun, 4 April 2026.

The recording system had changed

Sussex Police says it introduced One Touch Reporting in Adur and Worthing in 2024 so retail staff could report shop theft more easily. Its April 2026 account states that shoplifting had been under-reported, that the scheme was intended to increase reporting, and that it led to an “expected and significant increase” in reports. Sussex Police, 22 April 2026.

Sussex Police and Crime Commissioner Katy Bourne was making that reporting point when the first ranking appeared. Radio Worthing’s 17 February 2025 report attributed the high position to increased crime reporting and a dedicated business-crime unit, saying local businesses were using improved reporting systems that gave police a better picture of offending.

That was the right distinction to draw. The recorded figure did not need to be dismissed. Better reporting was part of what the figure represented.

Bourne’s later public account was more explicit. In comments published by Sussex Police in April 2026, she said she had encouraged retailers to report all offences, acknowledged that doing so initially increased recorded figures, and argued that the resulting intelligence allowed more crime to be tackled. The same statement reported Worthing town-centre shoplifting averaging 28 offences a month between March 2025 and February 2026, compared with 47 a month during the equivalent 2024–25 period. Sussex Police, 22 April 2026.

These are police and PCC accounts of local performance, not an independent evaluation. They establish what the force says it changed, what it recorded and how the PCC interpreted the results. They do not, by themselves, prove that One Touch Reporting caused the later fall.

The denominator also changes the ranking

The February 2025 ranking divided recorded shoplifting incidents by resident population. That answers a specific question: recorded offences relative to the number of people who live in the area. It does not measure the number of people actually using Worthing’s shops during the day. Radio Worthing, 17 February 2025.

A later CrimeRate.co.uk shoplifting table, updated in June 2026, uses daytime population for its town and city rates. It produces a different ordering: Kensington and Chelsea, Middlesbrough and Brighton and Hove are the top three, and Worthing is not among the listed highest-rate places. CrimeRate also states that its processed metrics can differ from government figures because of differences in data management.

That does not make the later table the definitive answer. Residential population and daytime population answer different questions. The comparison shows that a headline such as “worst town” is sensitive to the denominator and method chosen.

The local picture had also moved on

By spring 2026 there was a clear tension between an inherited label and the force’s current recorded figures. The Sun was still describing Worthing as Britain’s “shoplifting capital” on 4 April 2026. Eighteen days later, Sussex Police published the 28-versus-47 monthly average across two comparable twelve-month periods. Sussex Police, 22 April 2026.

The same Sussex Police release describes targeted patrols under Operation Apprentice, identification of prolific offenders, partnership work with retailers and Business Crime Reduction Partnerships, and says the activity had led to more arrests and convictions. Those are the force’s reported operational outcomes and should be read as such, rather than as an independent causal evaluation. Sussex Police, 22 April 2026.

A separate Sussex Police release gives a concrete enforcement example. After a high-value theft from the Tesco store in Durrington on 9 April 2026, police identified a silver Renault Mégane as the getaway vehicle. Surrey Roads Policing Unit officers stopped it on the M25 later that day; police reported recovering items linked to the Worthing theft and other suspected stolen property worth thousands of pounds. Two men, aged 19 and 22, were arrested on suspicion of shop theft and handling stolen goods and were later bailed pending enquiries. Sussex Police, 14 April 2026.

That example shows what targeted enforcement looked like in practice. It does not establish the prevalence of shop theft or prove that a particular intervention caused the wider recorded fall.

The ranking answered a narrower question than the headlines

The evidence supports four propositions. Worthing had a high police-recorded shoplifting rate relative to resident population in the data used for the February 2025 ranking. Sussex Police had changed its reporting system in a way intended to bring more previously under-reported shop theft into police records. ONS warns that shoplifting is frequently under-reported and that police-recorded figures can move with reporting and recording behaviour. Sussex Police later reported a substantial fall in the Worthing town-centre recorded monthly average across two comparable twelve-month periods. Radio Worthing, 17 February 2025 · Sussex Police, 22 April 2026 · ONS user guide, 2026.

What follows from those propositions is narrower than saying the original ranking was false. The ranking measured recorded offences using a particular denominator. The headlines increasingly treated that measure as though it were a direct measure of underlying shop theft. It was not.

One Touch Reporting is a credible explanation for part of the high recorded rate because Sussex Police says it was designed to increase reporting and produced the expected increase. The public evidence does not isolate how much of Worthing’s rate was created by improved reporting rather than changes in offending. It would therefore be too strong to say that reporting explains all, or any quantified proportion, of the ranking. Sussex Police, 22 April 2026.

The denominator adds a separate problem. Resident population and daytime population produce different comparisons because they represent different populations at risk of being present in a shopping area. Neither is universally correct for every purpose. A league table should therefore be read as an answer to a specified statistical question, not as a direct ranking of how much shoplifting “really” happens in each town.

There is no simple independent measure that resolves the problem. ONS notes that police-recorded shoplifting is the primary available source for this offence because the Crime Survey for England and Wales does not cover shoplifting, while also cautioning that under-reporting and reporting changes limit interpretation. ONS user guide, 2026.

A stronger local assessment therefore needs several indicators rather than one league-table rate: retailer reporting, repeat victimisation, prolific-offender activity, violence and abuse against shopworkers, criminal-justice outcomes and, where suitable data exists, independent retailer survey evidence.

How forces can handle a rise caused partly by better reporting

A force that deliberately makes crime easier to report has three broad choices when the recorded number rises.

Wait and explain later

The lowest-effort option is to publish the recorded series as normal and explain the reporting change when journalists or local leaders ask. That preserves a clean separation between operational reporting and communications, but it leaves an obvious interpretive gap. Once a simple league-table label has travelled, a later caveat has to compete with a much easier story. How police coverage travels in the national press — and how loosely it tracks what the public actually think — is measured directly in 25 years of Guardian police headlines.

Explain the measurement change when the scheme launches

The stronger option is to publish, at launch, what the reporting change is expected to do to the recorded series. That does not require the force to predict the size of the increase or dismiss an uncomfortable number. It requires the force to say what changed in the measurement system and what other indicators will be used to judge underlying harm.

Worthing shows the advantage. Katy Bourne’s early response already identified increased reporting as part of the explanation. Pairing that point with the denominator, the data period and a small set of additional outcome measures would have made the statistical question much clearer from the start. Radio Worthing, 17 February 2025.

Publish a broader retail-harm picture

The most informative option is also the most demanding. Forces could publish recorded shoplifting alongside reporting rates, repeat victimisation, violence and abuse against shopworkers, prolific-offender measures and criminal-justice outcomes. That would make it harder for one changing numerator to stand in for the whole local picture. Retail crime already offers a cautionary example of what happens when outcomes are left out of the account: the police response to fuel theft.

The limitation is practical: some of those measures are not routinely available, comparable or independently validated. A larger dashboard can create false precision if the underlying data is weak. The answer is not to publish every available number. It is to identify the few measures that answer different parts of the problem and state their limitations.

For a force introducing a reporting-improvement scheme, the second and third approaches are stronger than waiting for a ranking to force an explanation. That is an editorial judgement drawn from the measurement problem described above, not a tested communications intervention.

Publish the measurement change before the numbers move

For chief constables, PCCs and force data and communications teams, the practical steps are specific.

  1. At launch, state the expected recording effect. If a scheme is designed to surface previously unreported crime, say plainly that recorded offences may rise even if underlying offending does not rise by the same amount. Do not predict a causal effect the data cannot support.
  2. Publish the comparison rules with the number. When responding to rankings, give the data period, numerator, denominator, geographic unit and any material local recording change. If the ranking uses old data, say so.
  3. Use more than the recorded offence count to judge progress. For retail crime, select a small set of complementary measures such as reporting, repeat victimisation, violence against shopworkers, prolific offending and outcomes, and state where those measures are incomplete or force-reported rather than independently evaluated.
  4. Review the explanation when the evidence changes. If reporting stabilises, offending rises, or an independent evaluation points in a different direction, update the public account rather than allowing the original caveat to become permanent protection from bad news.

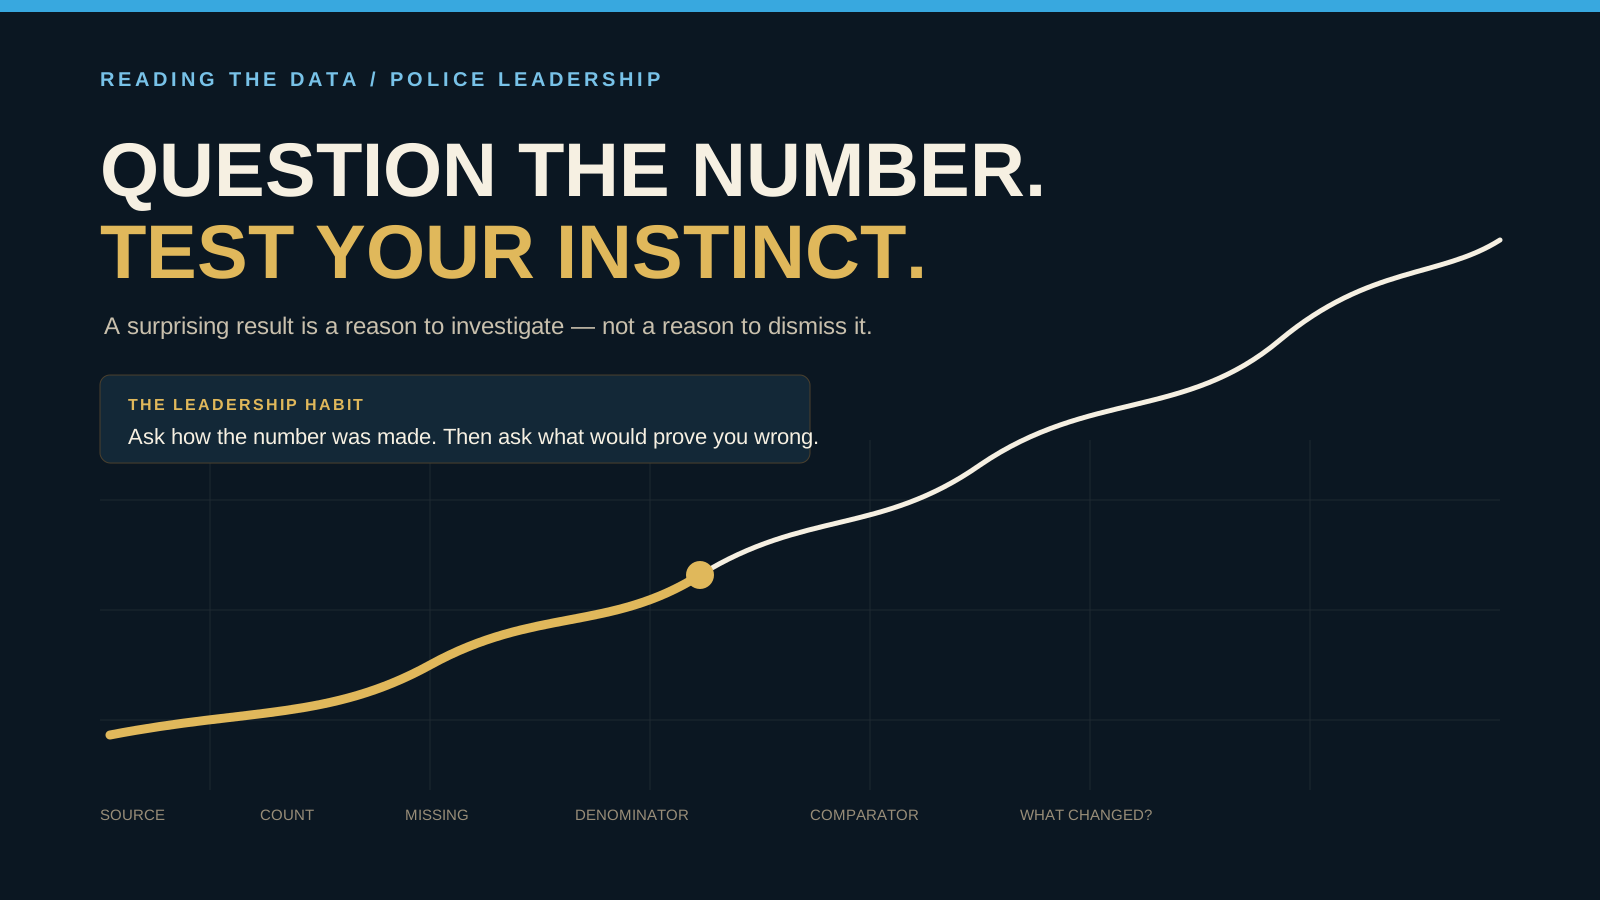
Success is not a favourable headline. It is a public account in which a reader can tell whether a number changed because offending changed, reporting changed, the denominator changed, or some combination of the three. Those questions are not unique to shoplifting — More or Less: Five Habits for Reading Police Statistics turns them into a routine for any police number.

Worthing is a useful case because the uncomfortable statistic was real and Katy Bourne’s emphasis on fuller reporting was also well founded. Better recording can make a place look worse before it makes the police better informed. The job for leaders is to explain that measurement change early enough that the number is not mistaken for something it cannot prove.

Share this article · shared 4 times

Rate this article

Discussion questions

  1. 01

    When a force deliberately improves crime reporting, what should it publish alongside the resulting rise in recorded offences?

  2. 02

    Should local crime rankings disclose their denominator, data period and known reporting differences before naming a 'worst' place?

  3. 03

    What measures should forces use alongside recorded shoplifting to distinguish better reporting from changes in underlying offending?

Related reading