
Data stories · England and Wales
Police arrests:
the story behind
the headline
The Sun’s arrest headline raises a fair question about police activity. Official figures show arrests rising across most forces. Explore what that tells us, and what it leaves unanswered.
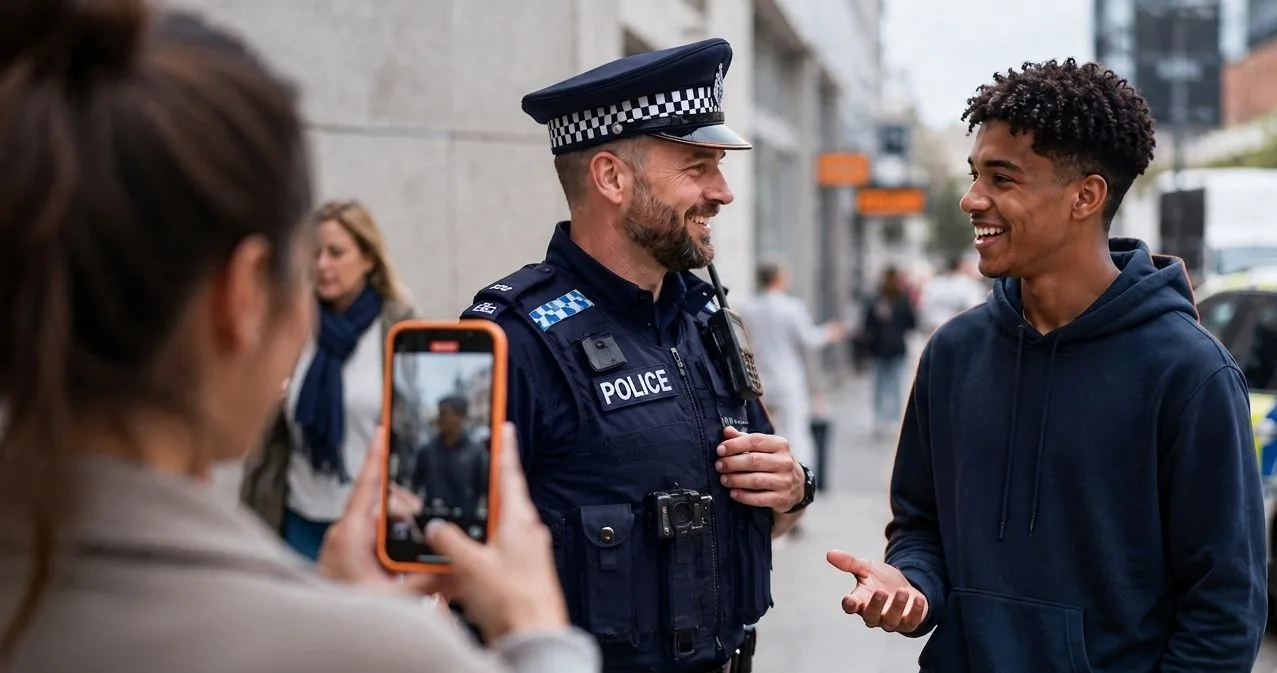
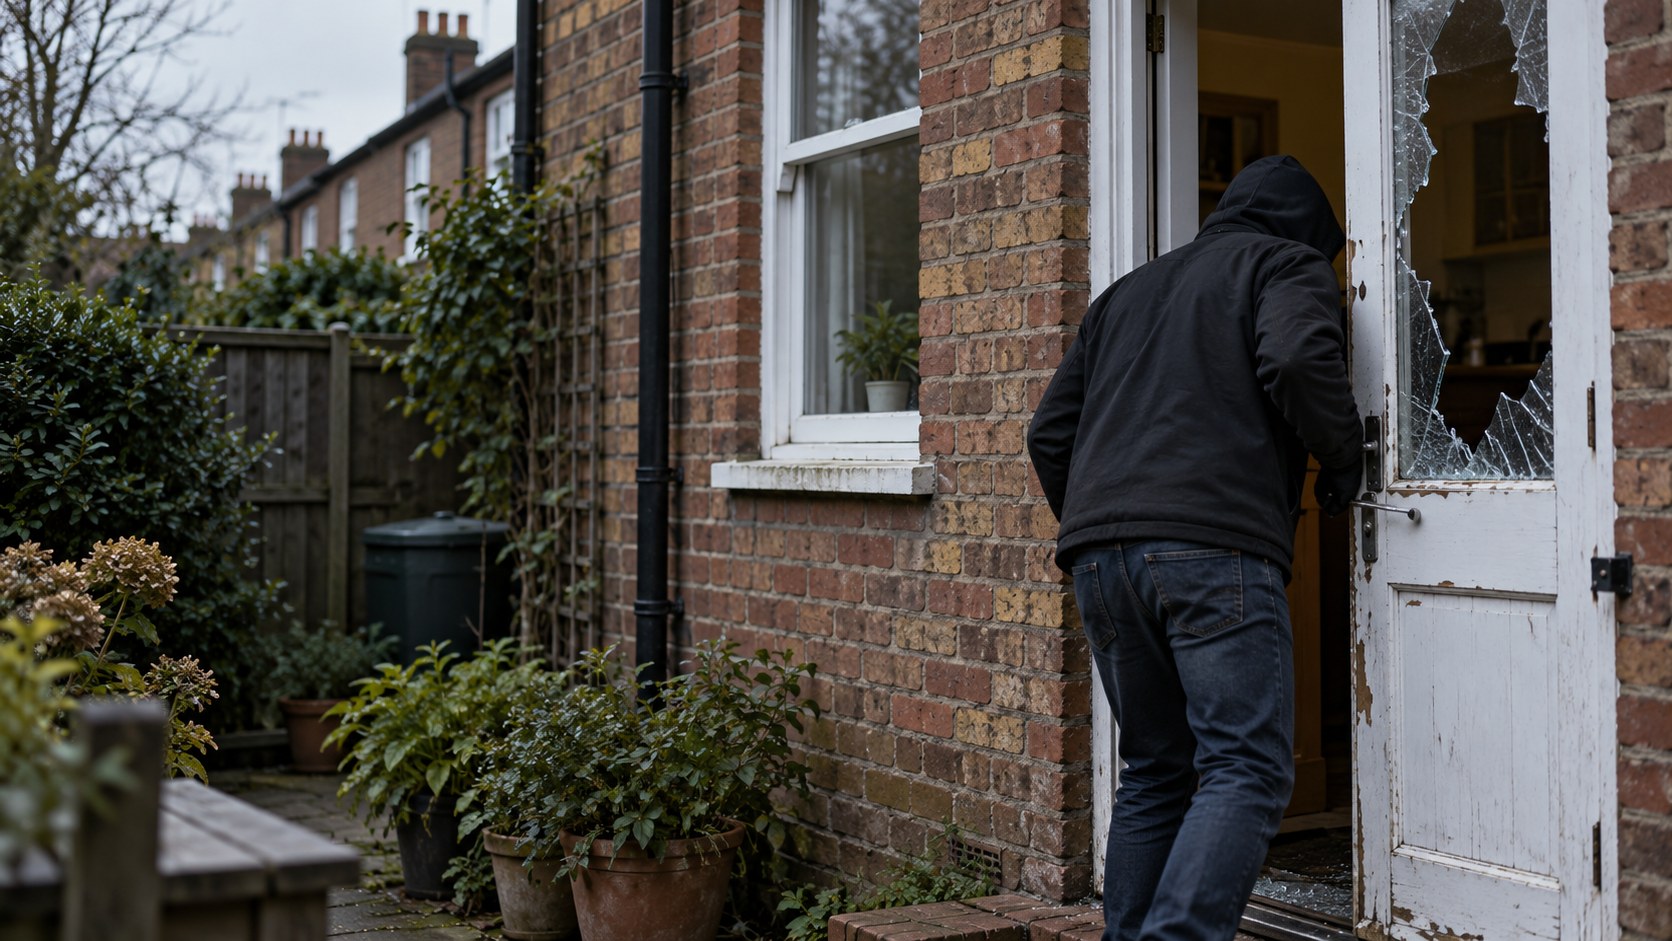
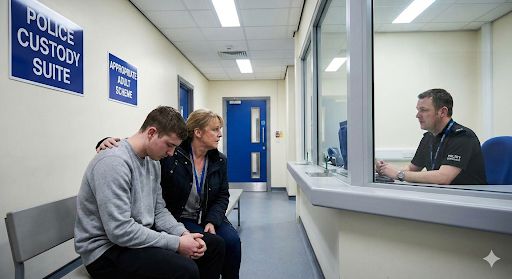
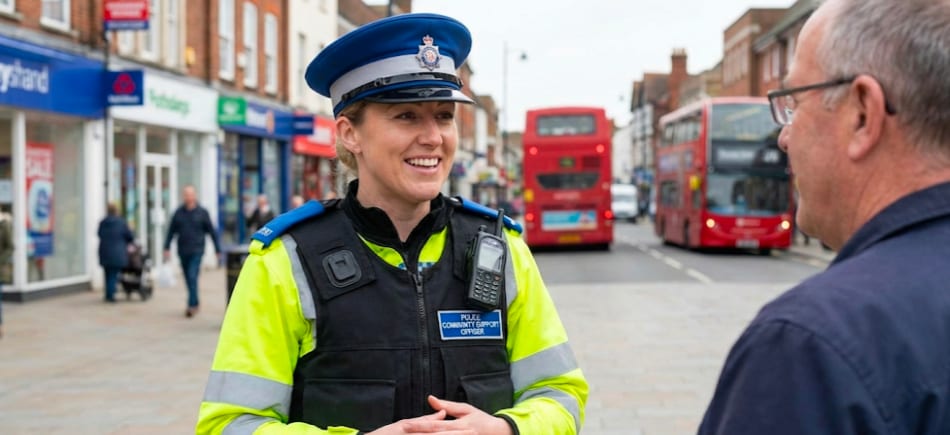
AI-generated illustration; not a photograph of a real arrest.
The two-minute read
What the numbers tell us.
What they leave unanswered.
Evidence
Recorded arrests rose by nearly 12% across the same 41 forces between 2022/23 and 2024/25.
Arrest events for notifiable offences; England and Wales.
Figures and calculationsRead the chapter →Understanding
Force totals describe activity. They cannot tell us whether an individual officer made the right decision.
Staffing, population and officer roles answer different questions.
The underlying dataRead the chapter →Options
Use the comparisons to choose cases for review before setting arrest targets.
A proposed use of the data, not a finding from the graphs.
PACE Code GRead the chapter →Next steps
Chief officers and analysts could review necessity, safeguarding and outcomes in cases with identified suspects.
The proposed review has not itself been evaluated.
Read the chapter →The Sun’s report that 40% of officers made no arrests invites an obvious question: what does that tell us about the work police are doing?
The wider picture is worth seeing. Across 41 forces in England and Wales, recorded arrests rose by nearly 12% between 2022/23 and 2024/25. Arrests increased in 36 of those forces, and grew faster overall than either staffing or the population. These are this article’s calculations from official arrest, workforce and population data.
That does not settle the question in the headline. A force can record more arrests while some of its officers make none. To understand those officers’ work, we would need to know their roles, the cases they handled and the decisions they made. The force totals used here cannot tell us that.
Start with the change over time
The clearest finding is that recorded arrest activity has been rising. The same 41 forces recorded about 654,000 arrests in 2022/23, 702,000 the following year and 732,000 in 2024/25. Keeping the forces the same helps us see the change without adding or removing areas halfway through. Annual figures and calculations.
More arrests in each year
Recorded arrests for notifiable offences, years ending March.
Arrests grew faster than staffing or population
Percentage increase from 2022/23 to 2024/25.
A growing population might explain some increase in arrests. So might having more officers. Here, both grew by around 2%, while arrests grew by nearly 12%. The rise in recorded activity was therefore larger than either of those changes. That is useful information, even though it does not explain why the increase happened. Staffing and population calculations.
Recording changes are part of the picture. Staffordshire and Derbyshire have specific cautions in the Home Office notes. Leaving both out still gives an increase of about 11%. The wider rise does not depend on those two forces. Calculation data.
There are not yet five published years wholly after Covid in this series. The latest Home Office release ends in March 2025. The graphs start with 2022/23–2024/25. You can add the two earlier years, but they include the disruption of Covid and some changes in how arrests were counted.
Three ways to look at your force
A total tells us how many arrests a force recorded. It is useful for following that force over time. Comparing totals between forces is less straightforward: a force serving a much larger area may naturally record far more arrests.
The second graph puts arrests alongside the number of residents. It asks how much arrest activity there was for the size of the local population. The third puts arrests alongside officer staffing. It asks how much activity there was for the size of the police team.
Neither is an individual officer’s score. The staffing figure includes all officer roles, and allows for part-time working. It does not show who personally made each arrest or how many officers were available on a particular shift. The population figure counts residents, so it cannot capture everyone who visits or commutes into an area. Home Office workforce data; ONS force area populations.
Sussex provides a simple example of why the years matter too. Its arrests rose from 16,814 to 18,998, then fell to 18,570. There was a fall in the latest year, but the total was still above where it began. Looking at the whole line tells us more than choosing either the rise or the fall alone. Sussex annual data.
Choose your force and a few others below. Look first at the direction over time, then see how the picture changes when population and staffing are taken into account. Different views can suggest different questions; they do not produce a verdict on which force is best.
Explore your force. Follow the change.
Start with a few forces. Each graph has its own selection. A force keeps the same colour, marker and line pattern throughout.
Arrests for notifiable offences under Home Office counting rules. 2022/23–2024/25 is the main comparison. The five-year option adds 2020/21 and 2021/22 as Covid-era context. Lancashire and City of London are outside this comparison; the method below explains why.
Source: Home Office arrest and workforce tables; ONS police force area population estimates. Sources, definitions and a downloadable dataset are provided in the article. Arrests are events, not unique people; these rates measure recorded activity, not individual officer performance.
Download the five-year data (CSV). It includes all 43 assessed forces, the figures behind each rate and the reasons for exclusions.
What the headline leaves us wanting to know
Counting arrests is a reasonable starting point for asking about police activity. But the Sun’s headline is about individual officers, while the official series here counts arrests recorded by forces. One cannot reconstruct the other. This analysis does not reproduce the original officer-by-officer returns behind that percentage.
An arrest count also cannot tell us whether an arrest was needed. Under the general arrest-without-warrant power in section 24 of PACE, the officer needs the relevant grounds and must believe arrest is necessary. Less intrusive ways of meeting the objective must be considered. Those are decisions about the circumstances of a case. PACE Code G, paragraphs 1.3 and 2.1–2.9.
The useful question is what happened in the cases behind the numbers.
The useful question is what happened in the cases behind the numbers. Before setting arrest targets, leaders could use a force’s figures to select a sample of cases with identified suspects for review: why an arrest was or was not made, whether necessary action was missed, and what happened to the victim and the investigation afterwards. This is a proposed use of the figures; the graphs do not establish what such a review would find.
There is enough here to ask better questions. Recorded arrests rose across most of the forces examined. Understanding what that meant for the public requires looking beyond the count and into the work itself.
Sources, exclusions and how the figures were calculated
Throughout this article, arrests means the Home Office series for notifiable offences. It does not cover every arrest under every power. Several offences on one occasion count as one primary arrest, and connected arrests have specific counting rules. The figures are not counts of unique people or every custody admission. Home Office definitions, section 3.1.2.
All 43 territorial forces in England and Wales were assessed. Lancashire is excluded from the constant 41-force comparison because of possible under-reporting in 2022/23 and 2023/24. City of London is separate because its small resident population makes the common population comparison unsuitable. Low arrest figures alone are not a reason to exclude a force. No estimate is substituted for excluded areas. Home Office arrest data and notes.
Devon and Cornwall is included from 2022/23 using the revised actual count in the latest table. Earlier counting changes limit comparisons before April 2022. Pre-2022/23 recording breaks also affect Avon and Somerset, Gloucestershire, Leicestershire and North Wales. Staffordshire’s methodology changed in 2023/24. Derbyshire’s 2024/25 total includes 1,062 arrests with an unknown offence category; these remain in this total-arrest analysis. The graphs retain relevant cautions. Original data notes.
The analysis sums OD_5+1 once across mutually exclusive demographic and offence categories. OD_19+1 is not added. Counts were checked against the latest summary tables. Force areas are matched using ONS codes. Population covers all ages and both sexes, using the June estimate within each financial year.
Arrests per 1,000 residents equals arrests divided by population, multiplied by 1,000. Arrests per officer equals arrests divided by the average of the opening and closing March full-time equivalent (FTE) staffing totals. Two half-time officers count as one FTE. This approximates staffing over the year; it does not measure deployment or hours worked. Closing officer headcounts are also in the download. Combined rates divide combined arrests by combined staffing or population, rather than averaging force rates.
The analysis is descriptive. It does not adjust for offence mix, explain causes or rank effectiveness. The main comparison keeps the same 41 forces. The two earlier years are context only. AI-assisted calculation and presentation tools were used to prepare this article.
Sources
- Home Office arrest open data to March 2025: OD_5+1 and Notes; released 6 November 2025.
- Home Office summary arrest tables: cross-check of totals.
- Home Office workforce open data: 22 July 2026 release; historical March 2020–2025 staffing.
- ONS force area population estimates, reference 3567: 12 August 2026 release.
- The Sun report: the starting point for this article, rather than the source of the force totals.