Speed camera vans: how police can reduce speeding and retain public support
In brief
Where to deploy speed camera vans, what to tell the public and how to measure results. Evidence on speeds, collisions and support, with plain-language examples for online posts and roadside messaging.

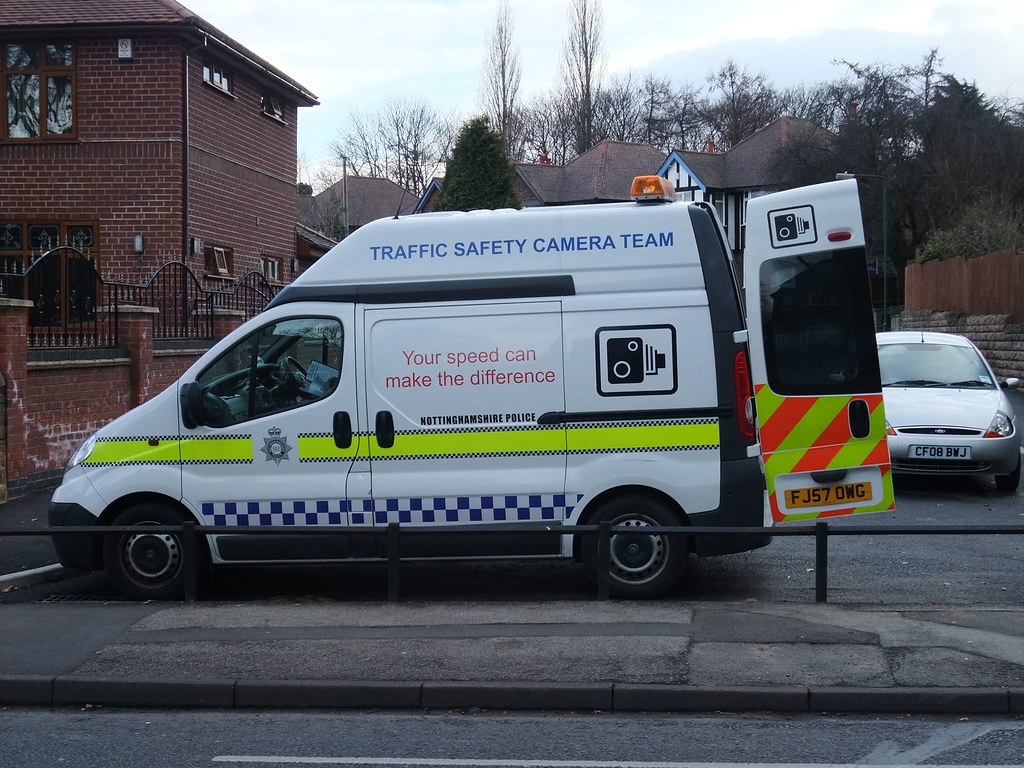
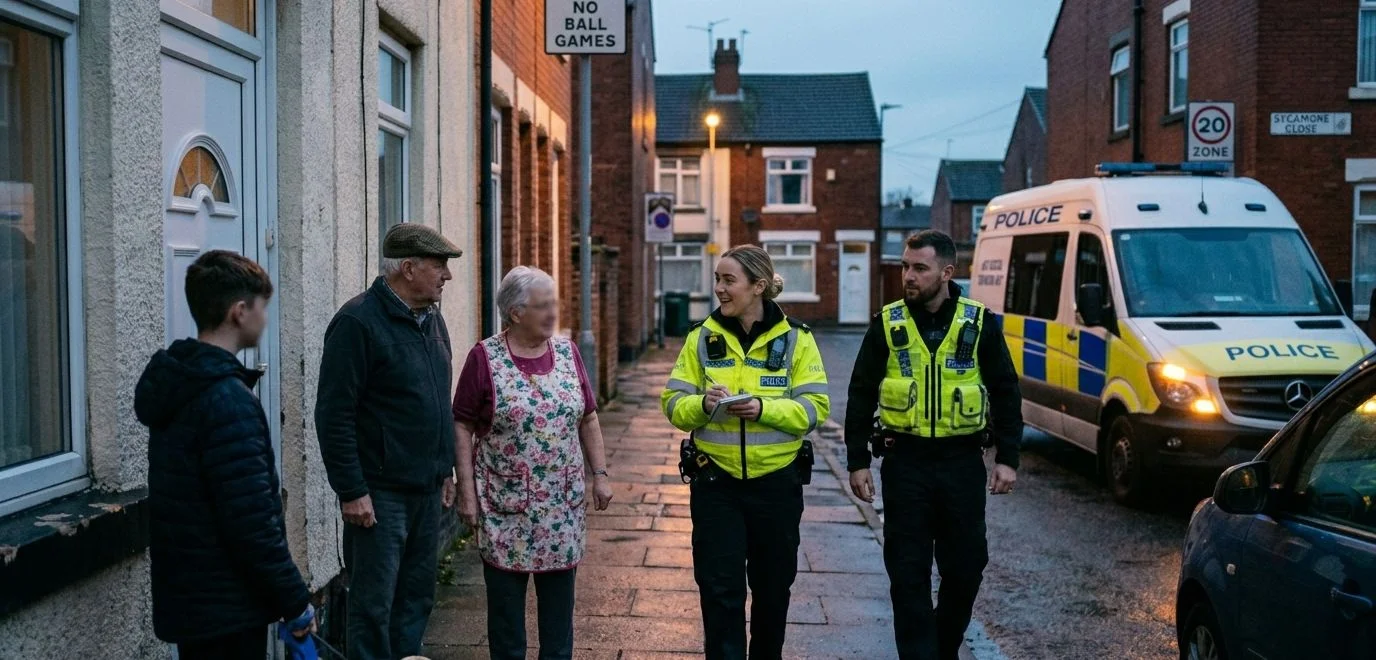
Nottinghamshire Police camera van, Wollaton, 6 March 2010. Photograph: Lee J Haywood, CC BY-SA 2.0. Historical illustration; this deployment is not being evaluated.
The strongest case for speed camera vans is a programme that targets demonstrable road danger, returns often enough to change behaviour and measures what happens between visits. Police leaders should be able to explain both the deployment and its results.
The evidence supports mobile cameras reducing speeding and injury collisions. It does not identify one universally best timetable, position or publicity strategy. The practical task is to combine established findings with a local test, while keeping public support under review.
A large number of tickets establishes that offences were detected. Whether the road became safer requires a different set of measures. Confidence also deserves its own evidence: public approval and lower speeds are related questions, but one cannot stand in for the other.
This guide focuses on decisions for police and road safety partners in England and Wales. International findings are identified where used; their effect sizes should not be assumed to transfer unchanged to British camera vans.
What the evidence supports
The 2010 Cochrane review by Wilson and colleagues included 35 studies. It found a consistent direction of benefit from speed cameras, but judged study quality moderate at best and could not establish a reliable single overall effect. It covered several camera arrangements, so its headline ranges should not be advertised as a van-specific guarantee.
The Department for Transport’s 2005 evaluation offers a more specific historical benchmark. At 1,448 new mobile camera sites, baseline speed surveys were compared with the average of surveys in 2002/03 and 2003/04.
Before-and-after speed surveys. These figures describe the programme studied, not a forecast for a new deployment.
The percentage figures are relative reductions, not percentage-point changes. Fixed sites had larger local reductions, but differences in roads and continuous versus intermittent operation prevent a simple claim that one camera type was inherently superior. National Safety Camera Programme, four-year evaluation, Table 2.3; archived report.
Direct British collision evidence is also encouraging. At 101 South Wales mobile camera sites, a controlled before-and-after study found a 51% reduction in injury collisions using a defined 500-metre route measure: rate ratio 0.49, 95% confidence interval 0.42–0.57. The association persisted through two years of programme follow-up. This was an observational local study, not proof that one visit has a two-year effect or that an entire force area would see the same reduction. Christie and colleagues, 2003.
The distinction between local and network effects is operationally important. An effective treatment on a small number of roads can still produce a modest change across the force area. Leaders should define the area they expect to benefit before evaluating it.
Deploy against a problem that can be described
England’s DfT Circular 01/2007 recommends explainable local selection criteria and identifies mobile enforcement as useful where collisions are spread along a route or the need varies by time. It also recognises community concerns and interim enforcement pending engineering work. These are guidance provisions, not a universal legal requirement to wait for a specified number of deaths.
The evidence and deployment guidance suggest combining measured speeding with collision history, road layout and exposure of people walking, cycling or crossing. Record when the risk occurs. A session at a convenient time answers little about a problem concentrated elsewhere in the week.
Community reports should prompt assessment and a response. They should not automatically displace roads with stronger evidence of danger simply because those residents have organised less effectively. That is an allocation principle proposed here, not a tested formula for distributing vans.
A deployment position must also allow safe operation. Where suitable parking and the location of danger do not align, the partnership should consider another treatment. The convenience of the equipment should not determine the definition of the problem.
| The problem | A defensible starting approach | What to check |
|---|---|---|
| Speeding concentrated at particular times | Repeat mobile visits during those periods | Speeds during comparable periods without the van |
| Risk spread along a route | Vary suitable positions within the risk area | Speeds beyond the camera and on alternative routes |
| Persistent speeding despite repeated visits | Joint review with the highway authority | Whether road design or continuous enforcement better addresses the problem |
| Community concern without reliable measurements | Establish a baseline and explain the assessment | Actual speeds, pedestrian exposure and the limits of collision data |
This table is an evidence-informed decision aid. The precise deployment pattern requires local testing.
Return often enough to affect the gaps between visits
A Canadian study monitored nine Edmonton sites over five weeks in summer 2015. Its analysis associated an average pattern of eight visits totalling 22 hours in a week with a residual effect of approximately five days and an almost 19% reduction in speed-limit violation rates. Gouda and El-Basyouny, 2017.
The useful finding is that residual effects can be measured. The study is too small and context-specific to prescribe 22 hours as the correct allocation for a British route.
Start with repeated visits and independent speed monitoring. If speeds recover quickly, revise the interval or pattern. If the effect holds, test whether fewer visits maintain it. This is a proposed adaptive approach: the aim is to learn how much deployment is needed without assigning the same dose to every road.
Ticket counts cannot do this job alone. They change with traffic volumes, enforcement hours, deployment times and the behaviour of drivers. Falling detections can indicate compliance or reduced enforcement; rising detections can indicate deterioration or more intensive work.
Visibility and unpredictability serve different purposes
A Belgian field experiment compared mobile radar enforcement with and without a digital advance warning on two road sections. The 85th-percentile speed fell by 4.5 km/h with a warning and 2.5 km/h without one. That measure describes the speed at or below which 85% of vehicles travelled. The warning condition also showed a stronger continuing effect during follow-up to one week. Wilmots and colleagues, 2016.
This supports testing advance warnings when the immediate objective is lower speed on a particular stretch. It was a small speed study, not a collision trial, and it did not test social media schedules.
For leaders, the practical distinction is between making the purpose visible and making every visit predictable. Publishing why a route receives attention does not require publishing a timetable that implies the remainder of the week is unenforced.
The evidence suggests that visible warnings can strengthen the immediate speed response. Alongside the deployment guidance, this supports explaining priority routes and the reason for enforcement. Varying suitable visits is an option to test for sustained compliance; the studies do not establish one best balance between publicity and unpredictability.
Public support depends on how enforcement is experienced
British research by Helen Wells examined camera enforcement from drivers’ perspectives and explored perceptions of unfairness through procedural justice. It provides evidence about the objections people raise and the experience of automated enforcement; it does not establish how many drivers share those views or prove that a communication change would remove them. Wells, 2008, The British Journal of Criminology.
A newer Australian survey of 1,168 drivers found overt cameras were perceived as fairer and more effective than covert cameras. It also found that broader beliefs about lawfulness and the obligation to obey were associated with self-reported speeding. Because it was cross-sectional, it cannot show that changing visibility caused greater compliance. Truelove and Oviedo-Trespalacios, 2026.
The leadership implication is to treat legitimacy as part of delivery. A well-explained policy can still fail if the location appears unrelated to danger, residents cannot get an answer or a genuine error is difficult to correct. These are practical risks inferred from the fairness research, not quantified predictions of lost support.
Give people reasons to support it
- Explain the site. Publish the measured problem and selection criteria.
- Show the result. Report speed changes and the remaining risk.
- Account for money. Explain actual funding and receipts accurately.
- Provide a response. Make questions and error correction straightforward.
Avoid reasons to distrust it
- Unexplained deployment. Leaving residents to guess why that road was chosen.
- Ticket league tables. Presenting detections as sufficient proof of success.
- Dismissive messaging. Mocking drivers or treating every question as hostility.
- Overstated claims. Promising lives saved from a short, uncontrolled comparison.
These are recommended practices and plausible risks informed by the research. They are not experimentally established estimates of gains or losses in British public support.
An accessible explanation does not mean agreeing that a particular offence should be excused. It means distinguishing disagreement about the rule from a reasonable question about where, why and how the police enforce it. Nor should the force infer public opinion from the loudest comments beneath a post. People who comment are not a representative sample.
Before enforcement, explain why this road
A useful public message answers a normal question: why is the van here? England’s guidance explicitly supports publishing site-selection reasons and local casualty results. That provides a basis for a plain-language account of the road’s history, the speeding problem and what the partnership will measure. DfT Circular 01/2007, paragraphs 50–54.
“There were [X] collisions on this road in [period]” is a reasonable starting point if the records support it. Explain which stretch, which dates and what is counted. “Incidents” could mean collisions, calls for service or near misses; use the actual measure. A collision is an event and a casualty is a person, so two serious-injury collisions do not necessarily mean two people were seriously injured.
This connects the reason for enforcement with checkable information. Where there is no recorded injury-collision history, explain the measured speeding or other assessed risk. A casualty total should not be invented or stretched to justify preventative work.
“Two serious incidents this month due to speed” needs more care. If the underlying record is two injury collisions with speed recorded as a factor, a clearer statement is: “Two collisions on this stretch resulted in serious injuries during [month and year]. Officers recorded speed as a factor in both.” Use it only if both parts are verified. The Department for Transport explains that contributory and road safety factors reflect officers’ judgements and may be recorded before extensive investigation. They are not automatically findings that speeding caused a collision. Exceeding the limit and travelling too fast for the conditions also describe different behaviours. DfT guide to road safety and contributory factors.
Use exact dates rather than “this month” on an image that may circulate later. Recent figures should be marked provisional where appropriate. Publish the broader history alongside a recent cluster so that the choice of period is visible.
At the van, keep the message short
The Belgian warning study supports an advance camera warning as a way to reduce speeds. It does not establish that a board listing deaths, injuries or percentage improvements beside a van will have the same effect. No controlled British evaluation of those particular messages was identified in this targeted review.
The evidence therefore supports a distinction between a brief warning for approaching drivers and a fuller explanation people can read safely. England’s camera guidance favours advance camera and speed-limit reminders. The highway authority should review any additional sign’s wording, positioning and suitability using the current Traffic Signs Manual. The examples below are communication concepts, not approved traffic-sign designs.
Approaching traffic
One clear instruction
Speed checks
Keep to the limit
Use appropriate camera-warning and speed-limit signing. Keep supplementary wording brief and assess visibility and distraction.
Community display or online
The reason and the result
Why this road?
See the local safety figures
Provide the route, dates, collision history, speed measurements and next review. Detailed displays belong where people can stop safely.
A board at the van’s location could explain the local problem to pedestrians or parked visitors, subject to a site assessment. A long collision account or a QR code should not become a reading task for a passing driver. Link the same dated information from the force website and social post so that residents can check it later.
This is an evidence-informed approach to test. Its additional effect on British public support remains uncertain. The programme should measure comprehension and perceived fairness as well as speed.
After enforcement, publish the measured change
The strongest outcome message is one the local measurements can support. “Average speeds were [X] mph lower” describes an observed result. “Our camera vans reduced speeds by [X] mph” also claims that the vans caused it. A simple before-and-after comparison cannot reliably separate enforcement from congestion, roadworks, changed limits or other interventions.
The historical British mobile-site result of 1.3 mph provides context for the article. It cannot supply the missing number for a particular road. The same applies to a percentage reduction in collisions taken from a different programme.
That wording must change if surveys were taken with the van present. State the conditions actually measured. Publish survey duration, vehicle counts and the proportion exceeding the limit alongside the mean. A lower average can conceal a continuing problem among the fastest drivers.
Worked example · invented numbers to explain the calculation
What would “20% fewer collisions” mean?
10 before → 8 after = 20% fewer. This is a relative reduction of two collisions. It is not a measured result from a road in this article.
For equal periods on the same defined stretch: “Police recorded eight injury collisions between [dates], compared with ten between [comparison dates]. That is two fewer, or 20%. These figures alone cannot tell us how much of the change was due to camera enforcement.”
Use equal periods, comparable recording and an unchanged route boundary. Check traffic exposure, wider trends and random variation. A fall from five to four is also 20%, which shows why the counts belong beside the percentage. For short periods and small totals, report counts and uncertainty rather than claiming a stable trend.
A stronger evaluation using suitable comparison roads and adjustment for other changes can support wording such as “the evaluation estimates that the programme reduced injury collisions by [X%]”. Publish its uncertainty range and methods. If cameras, road design and publicity changed together, attribute the estimate to that combined programme unless their individual effects were separated.
| Proposed claim | Evidence needed before using it |
|---|---|
| “[X] injury collisions on this stretch in [period]” | Verified collision records, dates and route boundary; a clear distinction between events and people injured |
| “Average speeds were [X] mph lower” | Comparable before-and-after speed surveys; state whether the van was present |
| “[X%] fewer vehicles were speeding” | Comparable proportions with vehicle totals; explain relative percentage versus percentage-point change |
| “Camera vans caused a [X%] reduction in collisions” | An evaluation capable of estimating the intervention’s effect, with uncertainty and alternative explanations assessed |
Can better messaging increase public support?
Fairness research supports giving people a clear explanation and a way to question the decision. It does not supply a reliable percentage gain in support from adding a collision total to a post or sign. The evidence for camera effectiveness is stronger than the evidence for a particular communication formula.
An Australian study of four Melbourne police districts associated high awareness of speed-related mass-media publicity with a 12% reduction in casualty crash frequency. The interaction between publicity and camera activity was not statistically significant. It did not establish an additional combined effect from putting the two together, or test the wording of British police posts. Cameron and colleagues, 2003.
Taken together, the evidence supports testing factual local explanations, visible warnings and transparent reporting. There is insufficient evidence here to promise that the suggested wording will increase support or reduce collisions by a particular amount.
Ticket totals can be published as activity data, accompanied by enforcement hours and traffic information where available. Presenting them as the main success measure leaves the public’s safety question unanswered. Dismissive replies, ridicule and exaggerated claims are plausible risks to perceived fairness; their effect should not be presented as a quantified research finding.
A practical trial would compare an existing factual message with an enhanced version explaining the local risk and evaluation, keeping enforcement conditions as similar as possible. Assess whether people understand why the road was chosen and regard that choice as fair. Measure speed separately. Likes and comments show attention, and an open comment thread cannot establish what the wider public thinks.
Give the programme a decision date
The roads policing lead and highway authority should agree an evaluation before expanding the programme. The following 12-week structure is an operational proposal, not a research-established optimum. It is designed to support decisions about deployment and messaging; a credible collision evaluation will generally need longer observation and more sites.
- Weeks 1–2: establish the baseline. Analysts select comparable routes, measure speeds and traffic at relevant times, review collision history and record existing publicity. Check site suitability and lawful speed-limit arrangements.
- Weeks 3–10: deliver and record. Log visits, hours, locations and messages. Continue independent measurements between visits. If testing alternative messages, keep other deployment conditions as comparable as possible and account for people seeing more than one message.
- Weeks 11–12: decide. Compare changes with the baseline and comparison routes. Report uncertainty, costs and public feedback. Continue, alter or replace the treatment against criteria agreed beforehand.
For public support, use the same questions before and after: is enforcement on this route justified, are locations selected fairly, and is the reason understood? Record recruitment and response rates. Include people who live along the road and people who use it, including pedestrians and cyclists. An open online poll can gather comments, but it should not be labelled a representative measure of support.
For safety, report mean speed, the proportion exceeding the limit and the highest-speed part of the distribution. Keep the legal limit distinct from any enforcement threshold. Monitor nearby roads where displacement is plausible and record changes such as congestion, roadworks or altered limits.
Collision analysis must also address regression to the mean: sites selected after an unusually bad period can improve without intervention. The national evaluation’s Appendix H found that allowing for this reduced estimated camera benefits, although benefits remained. Four-year evaluation, Appendix H.
Sussex already has a foundation for this account. Its police Road Safety Data Portal describes site maps, collision histories, offence records and baseline information, with a warning that exceptional sites may be absent. The next useful layer would connect deployment effort with speeds between visits and a recorded decision about the treatment. The portal’s existence alone does not prove effectiveness.
A chief officer should expect to see why each priority route was chosen, what changed and what will happen next. Where repeated enforcement leaves the underlying problem intact, another photograph of the van and another ticket total are insufficient. The partnership needs to change the treatment.
About the evidence: targeted review, searched 12 September 2026; not a systematic review. Older British evaluations remain important but do not establish present-day effect sizes. International studies inform specific decisions and are identified above. Messaging templates, public-support practices and the 12-week evaluation are evidence-informed proposals. Placeholder figures and the worked percentage example are not local findings. These elements have not been validated together as a programme.
Discussion questions
- 01
Do our deployment records explain the risk at each location and time?
- 02
What evidence do we have about speeds when the van is absent?
- 03
How would we distinguish support for the programme from reactions to a social media post?